
A Guide for Transport Planners: Measuring Journey Time Reliability
Average speed can tell you very little about how well a road network is actually performing. A corridor that averages 40 km/h but fluctuates unpredictably between 15 and 60 km/h depending on the day can be a far greater planning challenge than one that consistently operates at 30 km/h.
Traditional traffic reporting has largely relied on average speed and travel time because that’s what sensor networks could reliably capture. The result is that two corridors with identical averages can have completely different risk profiles: one may be predictable and reliable, while the other is highly variable and difficult to plan around.
The real challenge isn’t simply knowing how fast traffic is moving; it’s understanding how consistently, reliably and predictably the network is performing.
What Journey Time Reliability Actually Measures
Journey time reliability examines the distribution of travel times along a route over time, not just at the midpoint. In practice, that means tracking:
How long the trip takes with no congestion
The typical, forecast-adjusted travel time for a given period
What's really happening right now
How far actual travel time has strayed from what's expected, and for how long
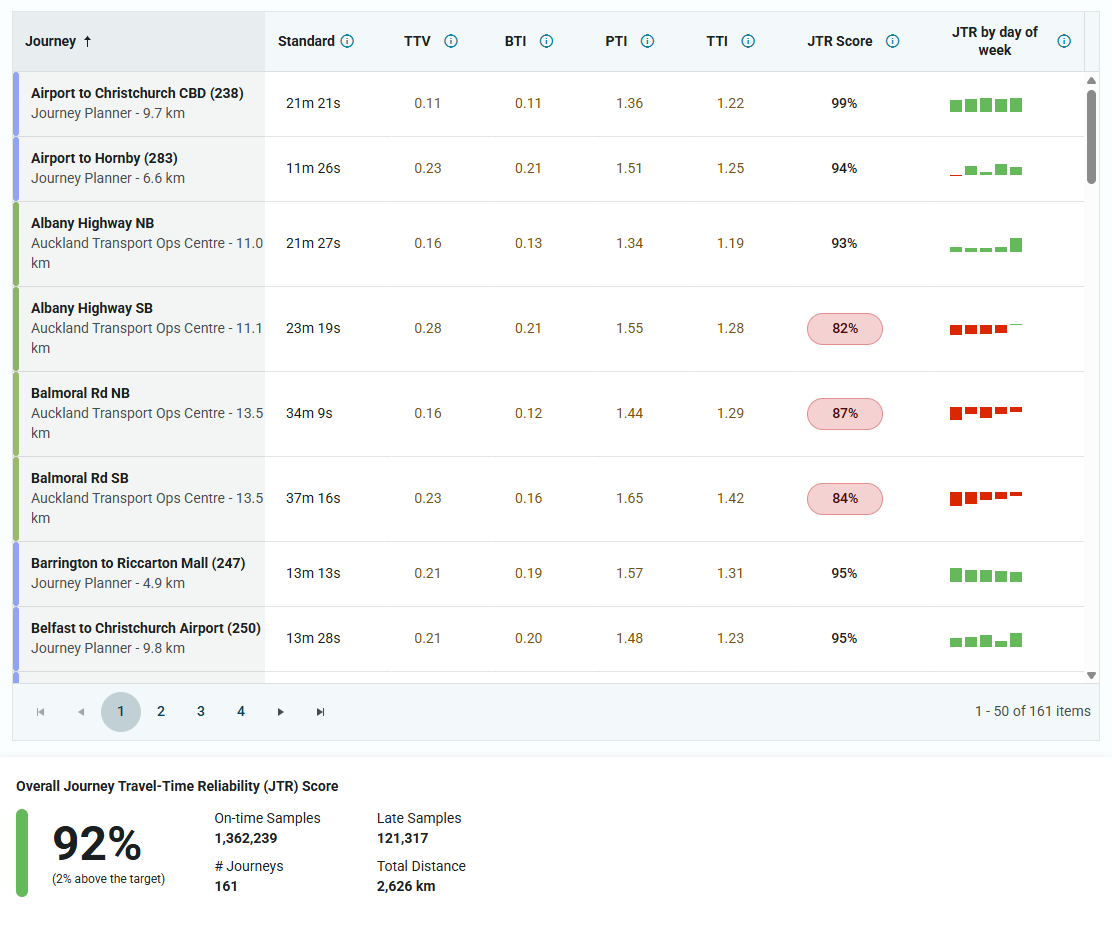
This analysis actually drives planning decisions, incident response, and public trust. TraceMark™ Flow also has the exact fields to track every monitored route in its Journeys view, so planners aren't left calculating reliability themselves from raw speed exports.
How to Put It to Work
1. Build a baseline. Before adjusting signal retiming or lane reallocation, you need a reliable baseline of expected versus actual travel time on the affected corridor. TraceMark™ Flow's historical data view gives you that baseline directly, across as many study routes as you define, without needing a separate data pull.
2. Segment by time period. Peak hours, off-peak, weekday versus weekend, reliability shifts across all of them. A corridor that's dependable at 2pm but chaotic at 5pm needs a different response than one that's unreliable all day. TraceMark™ Flow's timeframe slider lets you move between historical and live windows on the same route, so this segmentation takes just a few clicks.
3. Watch for recurring unreliability. Recurring unreliability (the same corridor, the same time, week after week) points to a structural capacity issue. Whereas non-recurring unreliability more often than not points to incidents, weather, or events, and requires a completely different response. TraceMark™ Flow flags unusual congestion separately from routine congestion for this reason, so the two don't get mixed together in a single number.
4. Report reliability for decision makers. When transport agencies ask, “Is the road network getting better?” reliability is a far more meaningful measure than average speed alone. TraceMark™ Flow’s Reports view turns this insight into clear, decision-ready reporting, giving stakeholders a practical way to communicate network performance, identify trends and support better transport planning.
Make Better Decisions
Establishing a baseline, identifying when and where reliability breaks down, distinguishing recurring congestion from unexpected disruption, monitoring anomalies in real time, and reporting performance over time all help build a clearer picture of how a network is actually operating.
Together, these insights give transport planners a stronger evidence base for deciding where to intervene, how to prioritise resources, and whether those interventions are delivering the desired results. Rather than relying on a single average speed or travel time, planners can use a combination of historical and near real-time data to understand what is happening across the network and make more informed decisions.